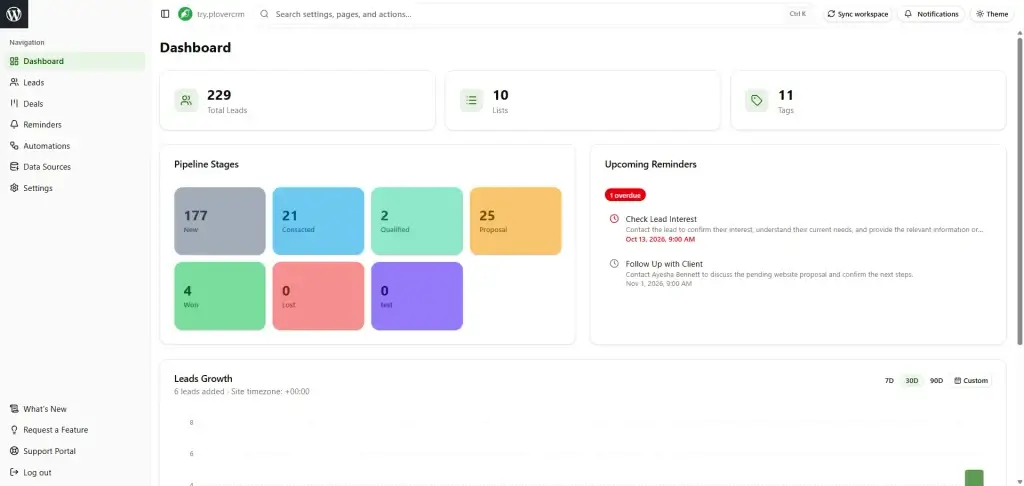
The dashboard gives you a quick view of the selected PloverCRM workspace. It brings together headline statistics, pipeline stage summaries, lead growth, reminders, and lists so you can understand current activity before opening individual records.
Use the dashboard as an overview, not as a substitute for checking the underlying leads and date ranges. Each panel reflects the selected workspace, available data, filters, permissions, and enabled features.
Before you begin #
- Sign in to the PloverCRM Web Dashboard.
- Select the workspace or connected website you want to review.
- Confirm that your role allows you to view dashboard information.
- Know the reporting period or comparison you want to examine.
- Refresh the workspace only after saving or canceling unsaved work elsewhere.
Open the dashboard #
- Sign in to the PloverCRM Web Dashboard.
- Confirm the workspace name and connected website in the header.
- Select Dashboard from the left navigation.
- Wait for the dashboard panels to finish loading.
- Check whether the dashboard displays a last-updated time, loading state, or connection notice.
- If the page is still loading, wait before interpreting a zero, blank, or partial value.
Understand dashboard statistics #
Dashboard statistic cards summarize key workspace totals. Depending on your account, they may include lead counts, new leads, activities, reminders, deals, pipeline value, or other enabled metrics.
- Read the title of each statistic card before interpreting its number.
- Check the date period or filter applied to the card, if shown.
- Compare the value with the previous period only when both periods use the same definition.
- Select a card when it is interactive and review the filtered records behind the total.
- Use the underlying lead list to confirm unusual increases or decreases.
- Do not treat a missing panel as a zero until loading and permission checks are complete.
A statistic can change when records are added, edited, deleted, reassigned, moved between stages, or filtered by date. The number is meaningful only in the context of its label and period.
Understand pipeline stage summaries #
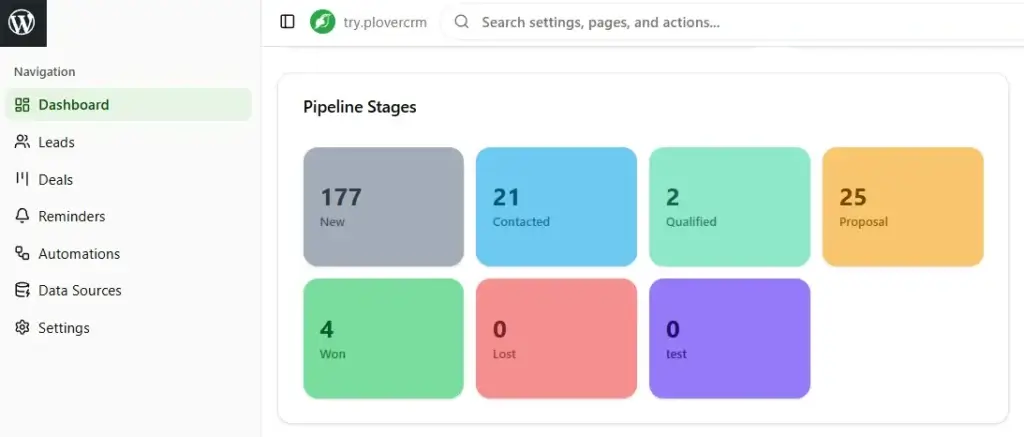
The pipeline summary groups leads or deals by their current stage. It helps you see where work is concentrated and where follow-up may be needed.
- Locate the pipeline or stage summary panel.
- Read the pipeline name and reporting period, if shown.
- Review each stage label and its record count or value.
- Compare stage totals with the total leads or deals expected for the same scope.
- Select a stage when it opens a filtered list.
- Review the matching records before changing a stage or assigning follow-up work.
- Open Manage Pipeline Stages when the stage definitions themselves need review.
A stage summary is not necessarily a forecast. It reflects the records currently assigned to each stage and may not include records outside your permission scope.
Read the lead growth chart #
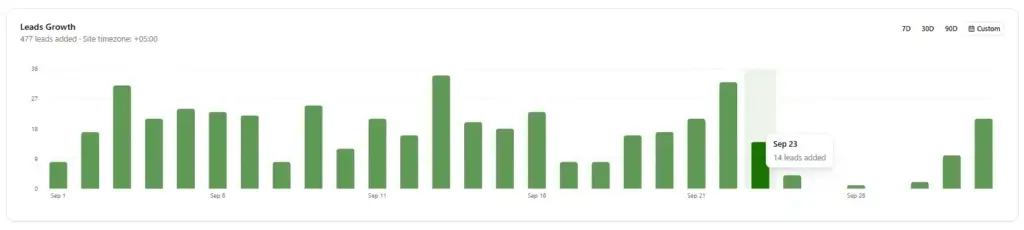
The lead growth chart shows how lead volume changes over a selected period. Use it to identify patterns and then inspect the leads that produced the change.
- Locate the lead growth or trend chart.
- Read the chart title, date range, and interval shown on the axis.
- Hover over a data point to view its exact value when the chart supports hover details.
- Compare peaks and drops with known campaigns, imports, form changes, or routing changes.
- Select a point or chart segment when it opens a filtered lead list.
- Confirm the result count and date filter in the linked list.
- Check the data source or import history when the trend does not match expectations.
The chart may show created leads, updated leads, or another defined measure. Read its label carefully before comparing it with a different report.
Use dashboard reminders #
The reminders panel highlights follow-up tasks associated with leads in the selected workspace.
- Locate the reminders panel.
- Review the reminder title, lead association, scheduled time, and status.
- Select a reminder to open its lead or reminder details when available.
- Complete the follow-up from the linked lead record.
- Mark the reminder complete only after the work is actually finished.
- Snooze or reschedule it when the follow-up is still required but the time has changed.
- Use Use the Global Reminders Page for a broader review.
Check the displayed time zone before acting on a reminder. Avoid creating a second reminder when an existing item already covers the same follow-up.
Use dashboard lists #
The lists panel provides a quick way to open lead groups organized by saved lists or other workspace categories.
- Locate the lists panel.
- Read the list name and lead count.
- Select a list to open the matching lead records.
- Confirm that the list filter is visible in the destination page.
- Review the records before applying an edit or bulk action.
- Return to the dashboard when you have finished reviewing the list.
A list count can change as leads are added, removed, reassigned, or updated. Do not assume that a count represents the entire workspace.
Refresh dashboard data #
- Confirm that there are no unsaved changes on the current page.
- Select Refresh, Reload, or the dashboard refresh control.
- Wait for all panels to finish loading.
- Check the updated timestamp or status message.
- Compare the panels again using the same workspace and reporting period.
- If the values remain stale, review the workspace connection and data source logs before refreshing repeatedly.
What to verify #
After reviewing the dashboard, confirm:
- The workspace and connected website are correct.
- Every statistic is interpreted with its displayed label and period.
- Pipeline totals, chart values, reminders, and list counts are not still loading.
- Any drill-down list contains the expected filters.
- You reviewed the underlying records before taking a bulk or destructive action.
Troubleshooting #
- If panels are blank, wait for loading to finish, refresh once, and check the workspace connection.
- If totals look wrong, confirm the date range, filters, selected workspace, and your permission scope.
- If a panel is missing, ask an administrator to check whether the feature is enabled for your plan and role.
- If a chart does not match an import or campaign, review the source logs and the chart measurement definition.
- If reminders appear at the wrong time, check the account or browser time zone and reminder settings.
- If a drill-down list is empty, clear inherited filters and confirm that the underlying records are within your scope.


